TREE DIAGRAM
Definition Of Tree Diagram
A tree diagram shows all the possible outcomes of an event.
All possible outcomes of an event are shown by a tree diagram
Examples of Tree Diagram
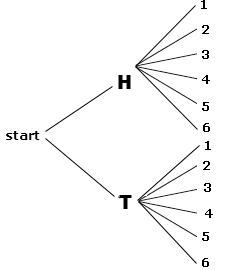
If a coin is tossed and the number cube is rolled simultaneously then the probability of getting head on the coin and the number 4 on the number cube is 1/12
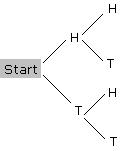
If two coins are tossed simultaneously then the possible outcomes are 4. The possible outcomes are HH, HT, TH, TT. The tree diagram below shows the possible outcomes.
Video Examples: Tree Diagrams
Solved Example on Tree Diagram
Ques: A box has 1 red ball, 1 green ball and 1 blue ball, 2 balls are drawn from the box one after the other, without replacing the first ball drawn. Use the tree diagram to find the number of possible outcomes for the experiment.

Choices:
A. 2
B. 4
C. 6
D. 3
Correct Answer: C
Solution:
Step 1: The possible outcomes are RG, RB, GR, GB, BG and BR.
Step 2: So, the number of possible outcomes is 6.
Quick Summary
- Tree diagrams show all possible outcomes of an event or series of events.
- Each branch represents a possible outcome.
- Probabilities can be calculated by multiplying probabilities along the branches.
- Useful for visualizing conditional probabilities.
🍎 Teacher Insights
Emphasize the importance of labeling each branch clearly with the outcome and its probability. Use real-world examples, such as coin flips, dice rolls, or drawing balls from a bag, to illustrate the concepts. Encourage students to check if the sum of probabilities of all outcomes from a single node equals 1.🎓 Prerequisites
- Basic probability concepts
- Understanding of independent and dependent events
- Fractions and decimals
Check Your Knowledge
Q1: A coin is flipped twice. What is the probability of getting heads then tails?
Q2: A bag contains 2 red balls and 3 blue balls. A ball is drawn and not replaced, then another ball is drawn. What is the probability that both balls are red?
Frequently Asked Questions
Q: When should I use a tree diagram?
A: Use a tree diagram when you have a sequence of events and you want to visualize and calculate the probabilities of all possible outcomes.
Q: How do I calculate the probability of a specific outcome using a tree diagram?
A: Multiply the probabilities along the branches that lead to that specific outcome.
Q: What is the difference between independent and dependent events in a tree diagram?
A: Independent events have probabilities that don't affect each other. Dependent events have probabilities that change based on the outcomes of previous events, and this needs to be reflected in the diagram.