SYSTEM OF INEQUALITIES
Definition Of System Of Inequalities
A System of Equations is a set of two or more equations with the same variables graphed on the same coordinate plane.
Examples of System of Inequalities
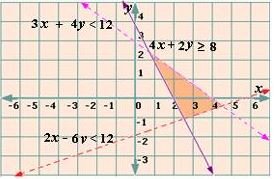
The figure below shows the graph of the system of inequalities
2x - 6y < 12,="" 3x="" +="" 4y="">< 12,="" and="" 4x="" +="" 2y="" ≥="" 8.="">
Video Examples: Algebra 2- Solving Systems of Equations
Solved Example on System of Inequalities
Ques: Which of the graphs defines the system of inequalities, x + y < 3,="" -="" 5x="" +="" 2y="" ≤="" 10,="" y="" ≥="" -="">
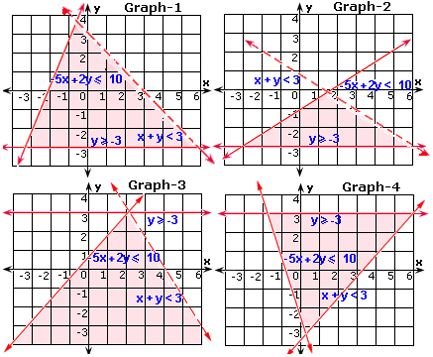
Choices:
A. Graph-1
B. Graph-2
C. Graph-3
D. Graph-4
Correct Answer: A
Solution:
Step 1: Graph all the three inequalities in the same coordinate plane.
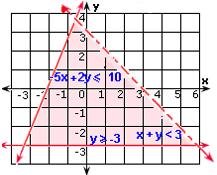
Step 2: The graph of x + y < 3="" is="" the="" half-plane="" below="" the="" dashed="" line="" x="" +="" y="3.">
Step 3: The graph of - 5x + 2y ≤ 10 is the half-plane on and below the solid line - 5x + 2y = 10.
Step 4: The graph of y ≥ - 3 is the half-plane on and above the solid line y = - 3.
Step 5: The graph of the system is the intersection of the three half planes as shown in the graph.
Step 6: Graph-1 is the correct answer.
Quick Summary
- A system of inequalities consists of two or more inequalities.
- The solution to a system of inequalities is the set of all points that satisfy all inequalities in the system.
- Graphically, the solution is the intersection of the shaded regions of each inequality.
🍎 Teacher Insights
Emphasize the importance of accurate graphing. Encourage students to test points to verify the shaded region. Provide various examples, including those with no solutions or infinitely many solutions.🎓 Prerequisites
- Solving linear equations
- Graphing linear equations
- Understanding inequalities
- Coordinate plane
Check Your Knowledge
Q1: Which graph represents the solution to the system of inequalities: y > x + 1, y < -x + 3?
Q2: Does the point (0, 0) satisfy the system of inequalities: x + y < 2, x - y > 1?
Frequently Asked Questions
Q: How do you know whether to use a solid or dashed line when graphing an inequality?
A: Use a solid line for inequalities with ≤ or ≥ (inclusive). Use a dashed line for inequalities with < or > (exclusive).
Q: How do you determine which side of the line to shade?
A: Choose a test point (not on the line) and substitute its coordinates into the inequality. If the inequality is true, shade the side containing the test point. If it's false, shade the other side.
Q: What does it mean if a system of inequalities has no solution?
A: It means there is no region where all the inequalities are simultaneously satisfied. Graphically, the shaded regions of the inequalities do not overlap.