STEM AND LEAF PLOT
Definition Of Stem-And-Leaf Plot
Stem-and-Leaf plot is a method of organizing numerical data in order of place value. The 'ones digit' and the 'tens digit and greater' of each data item is separated as leaves and stems respectively.
Video Examples: Stem and Leaf Plot
Example of Stem-and-Leaf Plot
The stem-and-leaf plot below shows the number of students enrolled in a dance class in the past 12 years.
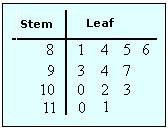
The number of students are 81, 84, 85, 86, 93, 94, 97, 100, 102, 103, 110, and 111.
Solved Example on Stem-and-Leaf Plot
Ques: Use the stem-and-leaf plot shown to find the total number of data items.

Choices:
A. 22
B. 23
C. 17
D. 19
Correct Answer: C
Solution:
Step 1: In a stem-and-leaf plot, the number of data items is equal to the number of leaves present.
Step 2: Number of leaves present in the above stem-and-leaf plot = 17.
Step 3: So, 17 data items are present in all.
Quick Summary
- Organizes data by place value
- Shows distribution of data
- Easy to create and interpret
🍎 Teacher Insights
Emphasize the importance of ordering the leaves. Use real-world examples to make it relatable.🎓 Prerequisites
- Place Value
- Ordering Numbers
Check Your Knowledge
Q1: How many data items are in the following stem and leaf plot: Stem: 1 | Leaf: 2 3 4 5
Q2: What is the largest value represented in the stem and leaf plot: Stem: 2 | Leaf: 0 1 5; Stem: 3 | Leaf: 2
Frequently Asked Questions
Q: What does the stem represent?
A: The stem represents the tens digit (or higher place values) of the data.
Q: What does the leaf represent?
A: The leaf represents the ones digit of the data.