STANDARD DEVIATION
Definition Of Standard Deviation
The standard deviation is defined as the average amount by which individual data items in a data set differ from the arithmetic mean of all the data in the set.
The standard deviation is the square root of the variance. It is denoted by the symbol .
More About Standard Deviation
If a set of data has n values  and if
  represents the mean of the data set, then the standard deviation is given by:
Video Examples: What is a "Standard Deviation?" and where does that formula come from
Example of Standard Deviation
If electricity bills (in dollars) of 8 houses are 70, 82, 76, 79, 83, 85, 72, 77 and mean  is 78 then find the standard deviation.
Standard deviation

Solved Example on Standard Deviation
Ques: A survey conducted by an automobile company showed the number of cars per household and the corresponding probabilities. Find the standard deviation.
Choices:
A. 4.24
B. 0.63
C. 0.79
D. 1.9
Correct Answer: C
Solution:
Step 1: Representing the data in the table and compute X .P(X) and X 2 . P(X)
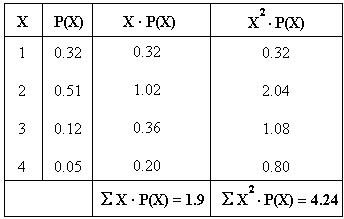
Step 2: From the table, we get 
Step 3: 
Step 4: Variance 
Step 5: Variance 
Step 6: Standard deviation 
Step 7: So, the standard deviation is 0.79.
Quick Summary
- Measures the spread or dispersion of a dataset.
- Calculated as the square root of the variance.
- Indicates how much individual data points deviate from the mean.
🍎 Teacher Insights
Emphasize the conceptual understanding of spread. Use real-world examples to illustrate the meaning of different standard deviation values. Visual aids like histograms can be helpful.🎓 Prerequisites
- Mean
- Variance
- Square Root
- Basic Algebra
Check Your Knowledge
Q1: Which of the following is the standard deviation?
Frequently Asked Questions
Q: What does a high standard deviation indicate?
A: A high standard deviation indicates that the data points are spread out over a wider range of values.
Q: What does a low standard deviation indicate?
A: A low standard deviation indicates that the data points are clustered closely around the mean.