QUANTITATIVE DATA
Definition Of Quantitative Data
The data that can be counted or measured is called to be Quantitative Data.
More About Quantitative Data
Quantitative data is also known as numerical data
Quantitative data can be analyzed by using statistical method and can also be represented by using graph
Discrete and continuous data are quantitative data.
Video Examples: Quantitative Data
Example of Quantitative Data
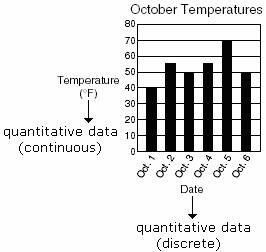
The above bar graph shows the temperature (°F) for the first six days on the month of October in a particular state. The 'Date' (on the horizontal axis) is quantitative (discrete data) as it is measuring the temperature of a particular date. The 'Temperature (°F)' (on the vertical axis) is quantitative (continuous data) as the temperature is counted.
Solved Example on Quantitative Data
Ques: Identify the quantitative data.
Choices:
A. Color of jerseys of each team in World Cup Soccer.
B. Name of the players of a soccer team.
C. Number of vehicles sold from a shop in a month.
D. Color of shirts displayed in a sales counter.
Correct Answer: C
Solution:
Step 1: The data that can be counted or measured is called to be quantitative data.
Step 2: Here, 'Number of vehicles sold from a shop in a month' is the quantitative data.
Quick Summary
- Quantitative data is numerical.
- It can be analyzed using statistical methods.
- It can be discrete or continuous.
🍎 Teacher Insights
Use real-world examples to illustrate the difference between discrete and continuous data. Emphasize the importance of choosing appropriate statistical methods based on the type of data.🎓 Prerequisites
- Basic arithmetic
- Understanding of variables
Check Your Knowledge
Q1: Which of the following is an example of quantitative data?
Q2: Is temperature an example of continuous or discrete data?
Frequently Asked Questions
Q: What is the difference between discrete and continuous quantitative data?
A: Discrete data can only take specific, separate values (e.g., number of cars). Continuous data can take any value within a range (e.g., temperature).
Q: Can I use quantitative data to create graphs?
A: Yes, quantitative data is often represented using graphs like bar graphs, histograms, and scatter plots.