LINEAR INEQUALITY
Definition Of Linear Inequality
A Linear Inequality involves a linear expression in two variables by using any of the relational symbols such as <,>, ≤ or ≥
More About Linear Inequality
A linear inequality divides a plane into two parts.
If the boundary line is solid, then the linear inequality must be either ≥ or ≤.
If the boundary line is dotted, then the linear inequality must be either > or <>
Example of Linear Inequality
Video Examples: Solving Linear Inequalities
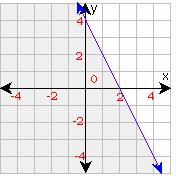
As the boundary line in the above graph is a solid line, the inequality must be either ≥ or ≤.
Since the region below the line is shaded, the inequality should be ≤.
We can notice that the line y = - 2x + 4 is included in the graph; therefore, the inequality is y = - 2x + 4. Any point in the shaded plane is a solution and even the points that fall on the line are also solutions to the inequality.
4x + 6y = 12, x + 6 ≥ 14, 2x - 6y < 12="" +="" 2x,="" 9y="">< 12="" +="" 2x="" are="" the="" examples="" of="" inear="" inequalities.="">
Solved Example on Linear Inequality
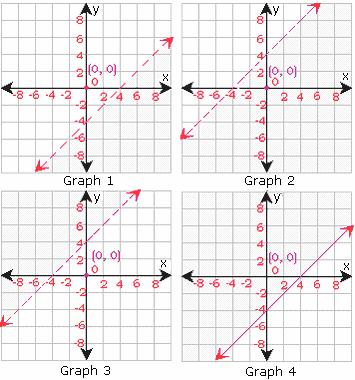
Ques: Which of the graphs best suits the inequality y < x="">< -4="">
Choices:
A. Graph 1
B. Graph 2
C. Graph 3
D. Graph 4
Correct Answer: A
Solution:
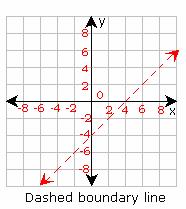
Step 1: Since the inequality 'involves less than' (<), use="" dashed="" boundary="" line="" to="" graph="" the="" inequality="" y="">< x="" -="" 4="" as="" in="" the="" below="" shown="" graph="">
Step 2: Test a point, which is not on the boundary line.
Test (0, 0) in the inequality.
y < x="" -="" 4="">
0 < 0=""><>
0 < -="">
Step 3: Since the inequality is false for (0, 0), shade the region that does not contain (0, 0).
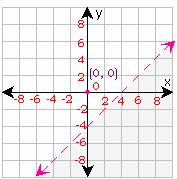
Step 4: Therefore, Graph 1 best suit the inequality y < x="">
Quick Summary
- A linear inequality divides a plane into two parts.
- If the boundary line is solid, the inequality includes ≤ or ≥.
- If the boundary line is dotted, the inequality includes < or >.
🍎 Teacher Insights
Emphasize the connection between the algebraic representation and the graphical representation. Use real-world examples to illustrate linear inequalities.🎓 Prerequisites
- Linear Equations
- Graphing
- Inequalities
Check Your Knowledge
Q1: Which inequality represents the graph with a dotted line and the region below shaded?
Frequently Asked Questions
Q: How do you determine which region to shade when graphing a linear inequality?
A: Test a point (like (0,0)) that is not on the boundary line. If the inequality is true for that point, shade the region containing the point. If it's false, shade the other region.