CURVE FITTING
Definition Of Curve Fitting
The curve which is obtained by plotting a set of data points is called Curve Fitting.
More About Curve Fitting
The curves like circular, elliptical, parabolic, and hyperbolic. Sine, cosine, etc. are also obtained by fitting data points.
Video Examples: Curve Fitting in Excel
Example of Curve Fitting
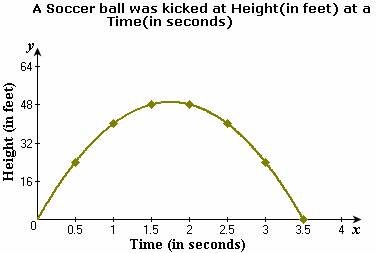
In the given figure, a curve is drawn through several points.
Solved Example on Curve Fitting
Ques: The table shows the number of workers in the industry, where t represents the
time in years since 2000. Draw a scatter plot and fit a curve for this data.

Choices:
A. W = 495(4)t
B. W = 360t2 + 1125t + 495
C. W = 1485t + 495
D. W = 360t2 + 495 Correct Answer: B
Solution:
Step 1: Plot the points and join with a smooth curve.
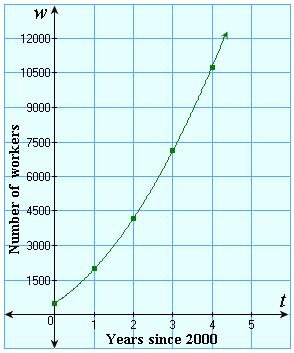 Step 2: The graph appears to be curved, not linear.
Step 3: As the ratios of consecutive number of workers is not same,
an exponential model does not fit the data.
step 4: W = at2 + bt + c [Quadratic model.]
Step 5: Consider the three data pairs from the table (0, 495),
(1, 1980), and (2, 4185) and substitute in the model.
Step 6: The equations obtained are
c = 495 ------------ (1)
a + b + c = 1980 ----------- (2)
4a + 2b + c = 4185 --------- (3)
Step 7: a = 360, b = 1125, and c = 495 [Solve the simultaneous equations.]
Step 8: So, the number of workers in the industry modeled by W = 360t2 + 1125t + 495.
Quick Summary
- Curve fitting involves finding a mathematical function that closely matches a set of data points.
- Different types of curves (linear, polynomial, exponential, etc.) can be used depending on the data.
- The goal is to minimize the difference between the curve and the actual data points.
🍎 Teacher Insights
Emphasize the importance of visualizing the data and understanding the context of the problem. Use real-world examples to illustrate the applications of curve fitting. Discuss the trade-off between model complexity and generalization ability.🎓 Prerequisites
- Algebra
- Graphing
- Data Analysis
- Basic Statistics
Check Your Knowledge
Q1: Which of the following is the primary goal of curve fitting?
Q2: What is a potential drawback of overfitting data in curve fitting?
Frequently Asked Questions
Q: How do I choose the best curve for my data?
A: Examine the scatter plot of the data to identify trends. Consider the underlying physics or principles of the system being modeled.
Q: What is overfitting?
A: Overfitting occurs when the curve fits the data too closely, capturing noise and random variations instead of the underlying pattern. This leads to poor predictions for new data.