CLASS INTERVAL
Definition Of Class Interval
While arranging large amount of data (in statistics), they are grouped into different classes to get an idea of the distribution, and the range of such class of data is called the Class Interval.
More About Class Interval
Class intervals are generally equal in width and are mutually exclusive.
The ends of a class interval are called class limits, and the middle of an interval is called a class mark.
Class interval is generally used to draw histogram.
Video Examples: Continuity of Function in Interval Examples
Example of Class Interval
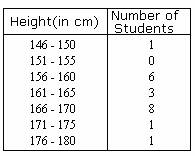
In the table above, heights of 20 students of a class are divided into classes with the size of each class interval being 5.
Solved Example onClass Interval
Ques: Plant scientists developed different varieties of corns that have a rich content of lysine which is a nutritious animal feed. A group of chicks were given this food to test the quality. Weight gains (in grams) of these chicks after 21 days are as recorded: 380, 321, 366, 356, 349, 337, 399, 384, 410, 329, 350, 340, 324, 396, 412, 420, 382, 318, 344, 438. By constructing a frequency distribution table for 7 classes, find the class interval in which the weight increase is maximum.
Choices:
A. 426 - 443
B. 335 - 351
C. 318 - 438
D. 336 - 353
Correct Answer: D
Solution:
Step 1: Range of the data = higher value - lower value = 438 - 318 = 120
Step 2: Width = Range/number of classes = 120/7 = 17.14 ˜ 18
[Round to the higher value.]
Step 3: Construct the class limits (weight gains) with width 18, so that the least and the highest values are included.
Step 4: The class limits, boundaries, tally marks and the frequency for each class (number of tally marks) are shown in the table.
Step 5:
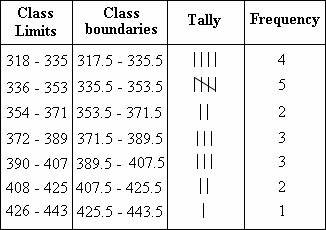
Step 6: The class interval in which the weight increase maximum is 336 - 353. [Frequency is more for the class 336 - 353.]
Quick Summary
- Class intervals are used to group data into manageable sets.
- They are generally of equal width.
- The ends of a class interval are called class limits.
- The middle of a class interval is called a class mark.
🍎 Teacher Insights
Emphasize the importance of choosing appropriate class interval widths to effectively represent the distribution of the data. Use real-world examples to illustrate the concept.🎓 Prerequisites
- Basic arithmetic
- Data representation
- Understanding of range
Check Your Knowledge
Q1: What is the class mark of the interval 20-30?
Q2: If the range of a dataset is 100 and you want to create 5 classes, what is the approximate class interval width?
Frequently Asked Questions
Q: What happens if the number of classes is too small or too large?
A: Too few classes may hide important patterns in the data, while too many classes may result in a sparse distribution that is difficult to analyze.
Q: How do I determine the appropriate number of classes?
A: There are several rules of thumb, such as Sturges' rule, which suggests the number of classes k ≈ 1 + 3.322 * log(n), where n is the number of data points.