Related Links
BOX AND WHISKER PLOT
Definition Of Box And Whisker Plot
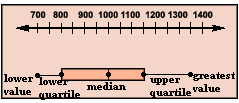
A Box-and-Whisker Plot shows the distribution of a set of data along a number line, dividing the data into four parts using the median and quartiles.
Examples of Box and Whisker Plot
A sample of box-and-whisker plot is shown below

Video Examples: Box and Whisker Plot
Solved Example on Box and Whisker Plot
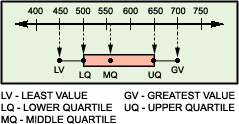
Ques: The box-and-whisker plot below shows the amount of calories in some bakery items. Use it to find the difference between the upper and lower quartiles.

Choices:
A. 150
B. 650
C. 500
D. 250
Correct Answer: A
Solution:
Step 1: From the box-and-whisker plot shown, we learn that the upper quartile value is 650 and the lower quartile value is 500.
Step 2: So, the difference between the two values is 650 - 500 = 150.
Real world Connections for Box and Whisker Plot
Box-and-whisker plots are useful in comparing data.
For example, the prices of different commodities, weights of students in a class, your test scores, etc can be compared using box-and-whisker plots.