Related Links
Pictograph
Definition Of Pictograph
Pictograph is a way of representing statistical data using symbolic figures to match the frequencies of different kinds of data.
Examples of Pictograph
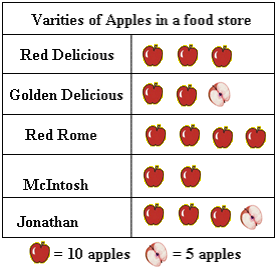
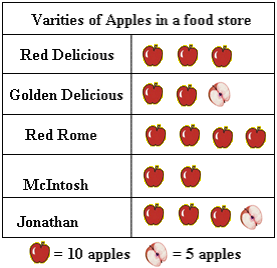
The pictograph shows the number of varieties of apples stored at a supermarket.

Video Examples: Excel Charts Pictograph
Solved Example on Pictograph
Ques: Use the pictograph to find the total number of apples stored in the supermarket.

Choices:
A. 150
B. 120
C. 140
D. 200
Correct Answer: A
Solution:
Step 1: The pictograph shows 14 full apples and 2 half apples.
Step 2: So, there are 140 + 10 = 150 apples stores in the supermarket.
- Constructing-Pictographs-Gr-3