Related LinksVideo Examples: Histogram
Histogram
Definition Of Histogram
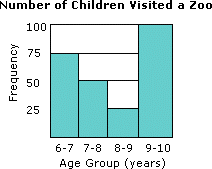
A histogram is a bar graph that shows how frequently data occur within certain ranges or intervals. The height of each bar gives the frequency in the respective interval.
Examples of Histogram

Video Examples: Histogram
Solved Example on Histogram
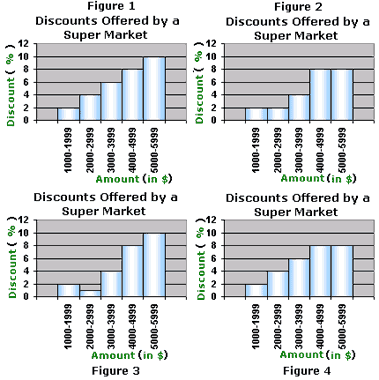
Ques: The discounts offered by a super market are as shown in the table. Which of these histograms is the correct representation of the data?

Choices:
A. Figure 1
B. Figure 2
C. Figure 3
D. Figure 4
Correct Answer: A
Solution:
Step 1: The heights of the bars in the histogram indicates the discount offered (in %) for the corresponding amount (in $)
Step 2: Observe the graphs to match the heights of the bars in each graph with the values in the table.
Step 3: It can be observed that the heights of the bars in Figure 1 matches with the values in the table.
Step 4: So, Figure1 is the correct representation of the data.
- Interpreting-Histograms-Gr-6