Related Links
Continuous Data
Definition Of Continuous Data
The data that is continuous (without breaks) in a selected range is known as Continuous Data.
More About Continuous Data
Continuous data is the opposite of discrete data.
Continuous data will have infinite number of possible values within the selected range.
Line graphs and histograms are used to represent continuous data.
Examples of Continuous Data
The height of a boy over time is an example of continuous data.
Varying temperature from maximum to minimum point on a particular day is a continuous data.
Video Examples: Line Math
Solved Example on Continuous Data
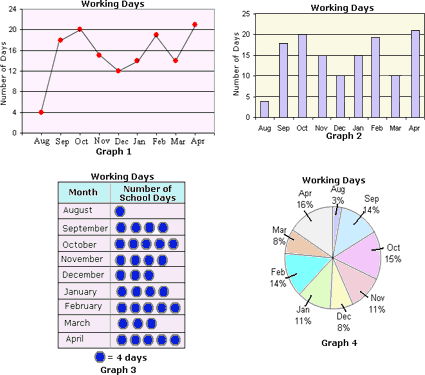
Ques: Which of the figures has the lines P, Q, R, and S converging to the point A?

Choices:
A. Graph 1
B. Graph 3
C. Graph 2
D. Graph 4
Correct Answer: A
Solution:
Step 1: Of the four graphs listed, line graph displays continuous data. [The graph that is drawn without any gap in an interval is used to display continuous data.]
Step 2: So, Graph 1 displays continuous data.