Related Links
Circle Graph
Definition Of Circle Graph
A Circle Graph is a graph in the form of a circle that is divided into sectors, with each sector representing a part of a set of data.
Example of Circle Graph
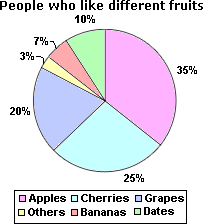
In the example shown below, the circle graph shows the percentages of people who like different fruits. Each sector in the circle graph represents a separate percentage of people that like the respective fruit.

Video Examples: Circle Graphs
Solved Example onCircle Graph
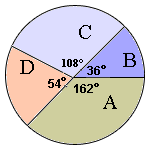
Ques: Find out the angle covered by A, B, and C in the circle graph.

Choices:
A. 306°
B. 162°
C. 36°
D. 108°
Correct Answer: A
Solution:
Step 1: Angle covered by A, B, and C is 108° + 162° + 36° = 306°.