Related Links
BAR GRAPH
Definition Of Bar Graph
A bar graph is a graph that compares different amounts using bars.
Examples of Bar Graph
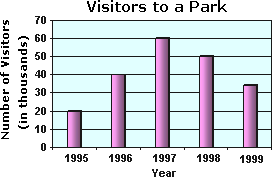
The bar graph below shows the number of people visited a park in different years.

The graph helps you compare the number of visitors between any two years.
Video Examples: How To Make and Use a Bar Graph
Solved Example on Bar Graph
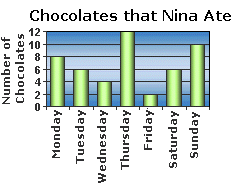
Ques: The bar graph shown represents the number of chocolates that Nina ate last week. Which day did she eat the most number of chocolates?

Choices:
A. Wednesday
B. Thursday
C. Sunday
D. Monday
Correct Answer: B
Solution:
Step1: The bar for Thursday is the tallest in the bar graph shown
Step2: So, Nina ate the most number of chocolates on Thursday.
Real-world Connections for Bar Graph
Bar graphs are used to compare categorical data using bars. Amount of rainfall on different days in a week, the favorite colors of grade 3 students, the number of students enrolled in different grades in a school in a particular academic year, etc are examples where you use bar graphs.
You can use bar graphs to compare your test scores.
- Constructing-Bar-Graphs-Gr-3
- Interpreting-Bar-Graphs-Gr-3